FlowMe Data Logger Dashboard: Advanced Cellular Data Loggers for Flowmeters
Are you in need of a robust data analytics tool and resource for your flowmeters? Look no further than the FlowMe data logger dashboard – a cutting-edge solution designed to cater to all your data management needs. Discover the full potential of your flowmeter data with our feature-rich platform, optimized for cellular data loggers.
Powerful Data Analytics Made Simple:
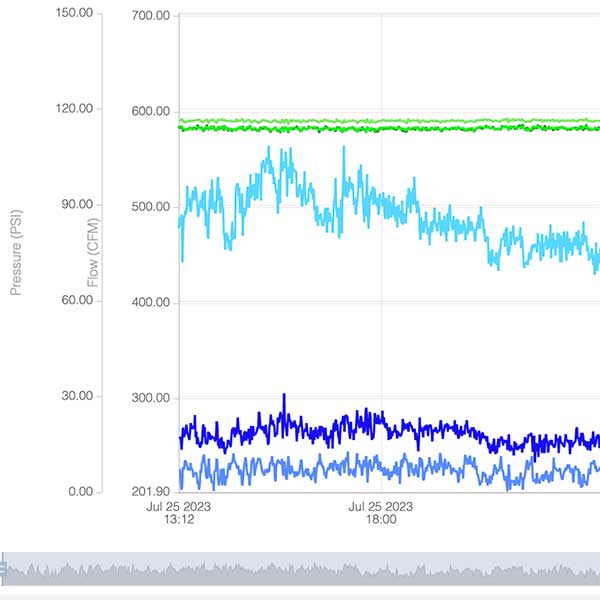
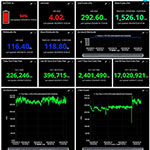
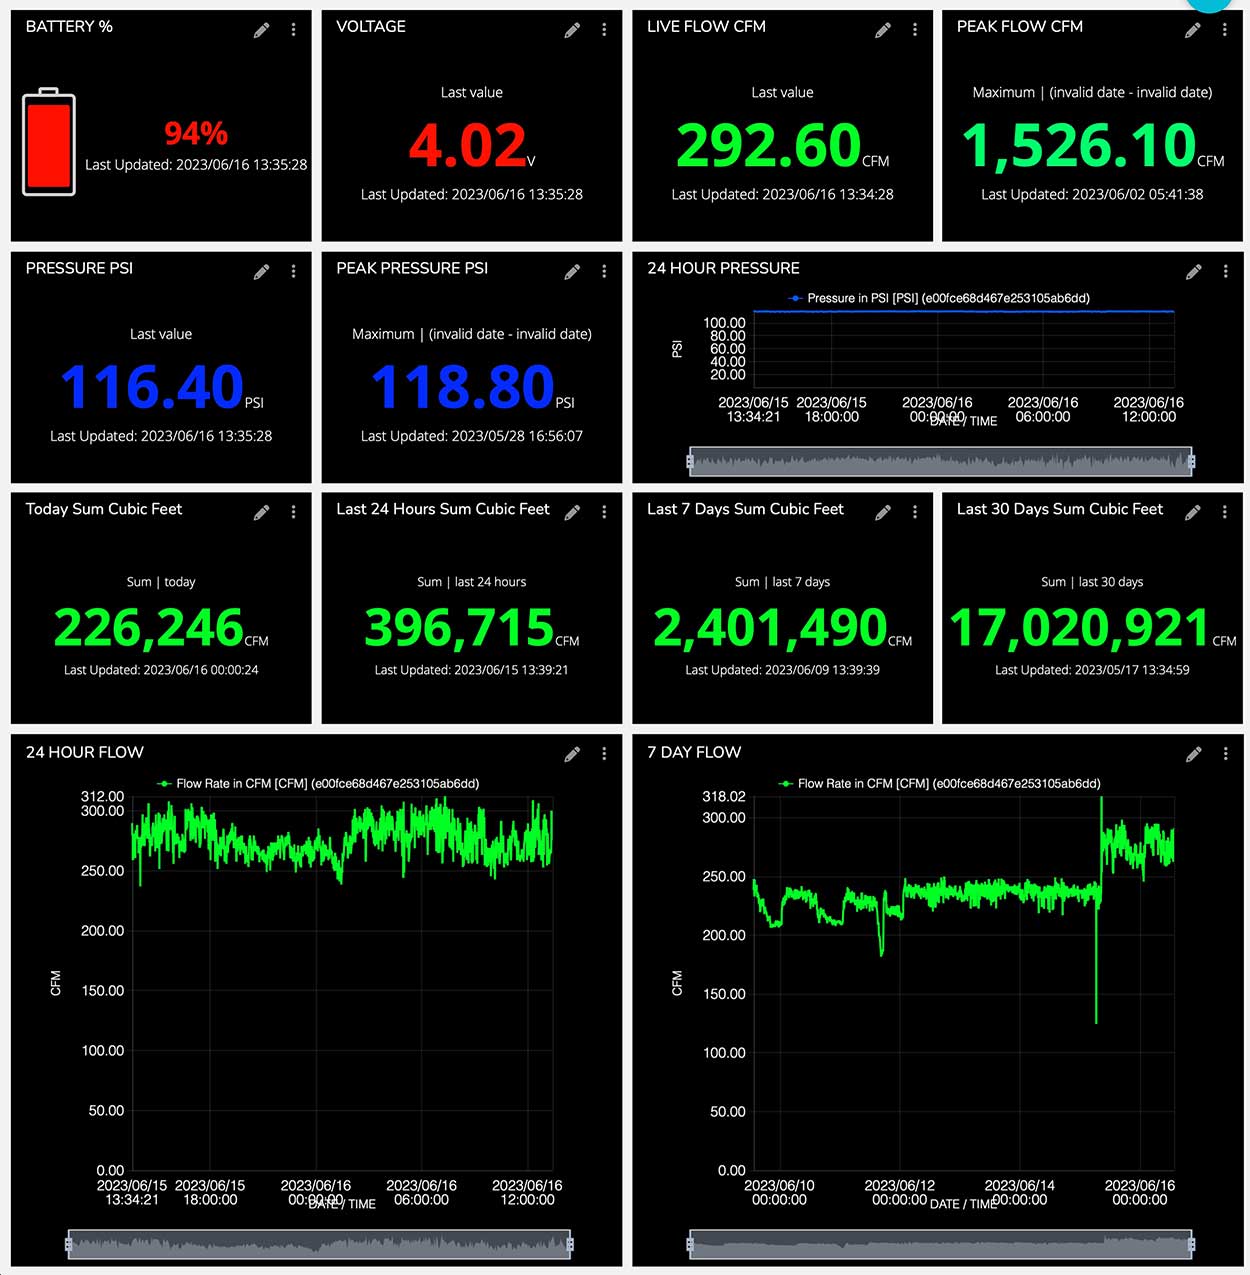
The FlowMe data logger dashboard empowers you with seamless data analysis. Dive deep into your collected data and gain valuable insights with visually engaging graphs, all conveniently displayed on your dashboard.
Customized Downloads for Ultimate Flexibility:
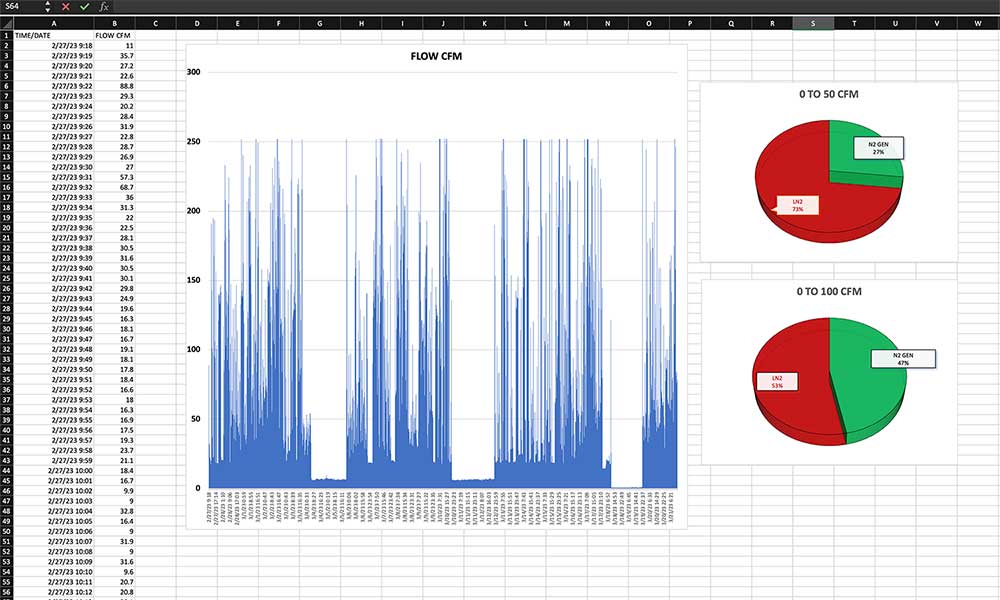
Enjoy the freedom to create customized data downloads based on any timeframe of your choice. Whether you need data from the last 5 minutes or the past two years, our dashboard caters to your specific requirements. Each data point can be effortlessly exported to a CSV spreadsheet, compatible with your favorite spreadsheet program – be it Excel, Google Sheets, or Pages.
Secure Online Backup for Peace of Mind:
Your data’s safety is our top priority. With our server backup feature, rest assured that your valuable information is securely stored online for up to two years.
Unlimited Data Exports for Maximum Productivity:
No limitations here! Create as many downloads and data exports as you need. Our dashboard ensures you have all the data you require at your fingertips.
Tailored Graphs for Enhanced Insights:
Get a comprehensive understanding of your flowmeter variables with custom graphs that can be effortlessly created on your dashboard. Choose the variables and timeframes that matter most to you, and gain deeper insights into your data.
Seamless Multi-Device Access:
Access your data whenever and wherever you need it. The FlowMe data logger dashboard is fully responsive, allowing you to view and manage your data on desktops, tablets, or smartphones.
Unlock the true potential of your flowmeter data with FlowMe’s state-of-the-art data logger dashboard. Start optimizing your flowmeter performance and making data-driven decisions like never before. Embrace the power of cellular data loggers and experience the difference today.
For more information, please fill out our contact form.
Dashboard Display Image
Data Graphed In Excel
Flow and Pressure Overlay Graph
